 Home
Home| Application | IntelligentViewer |
| Application Summary | Imagine that you have a
scheduling system which produces a schedule in form of a report. The
report has all the data you need, but the data are not presented in
graphical form so you cannot see the big picture.
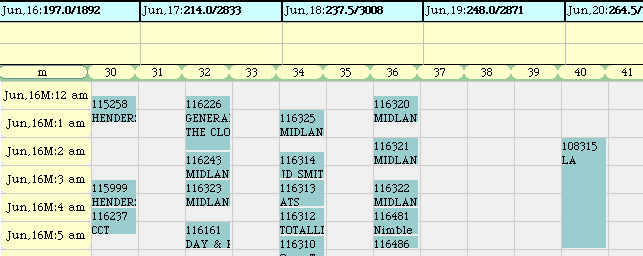
SMIntelligentViewer solves the problem, it takes the report and
produces
a schedule which look like table with all the data nicely grouped. |
| For
more details |
Click here and e-mail
us a sample of your
report
and describe it. We will configure the system and demo it to
you
over Internet. |

